Watching a brain grow in Grove
What does an AI agent's memory look like? For nearly every agent the question has no answer, because the memory has no appearance: it is rows in a database built for machine lookup, summaries folded into the model's working text, records retrieved and consumed where no one can watch. The owner of such an agent holds exactly one instrument for examining what it knows, which is to ask it and weigh the reply. Whatever confidence that produces is confidence in answers; the memory itself is never seen, and trusting it is an act of faith.
For nearly ten months our lab, X-Arc, has run the other arrangement. One of our agents, CCL, AI partner to the lab's CEO, works from a typed knowledge graph, the brain this note watches grow: every fact a node, every relationship an edge with an explicit meaning, every claim carrying the dates through which it held. This series has reported that graph in counts and mechanisms since it held 432 nodes, but it has never put the picture on the page; the closest was a single still on the Grove release page, which introduced the product built from this graph and its live viewer, a page that renders the operating graph itself, read-only, in a browser. This note points that viewer at the lab's own memory and records what became visible: the path a fact travels into memory, the shape those months of work have taken, the growth a single day writes, and what looking does to trust.
The write path
The graph does not grow by importing anything. It grows because the agent, in the course of ordinary work, writes what it learns. A fact surfacing in the day's conversations and actions is extracted by the model and lands as a typed write: a node of one of the fourteen kinds, edges naming its relationships with explicit verbs, all of it dated for the period through which it holds. An earlier note traced the learning discipline behind those writes; what matters here is the shape they leave behind. Because every entry is typed and dated, code can do the rest without judgment. Once a day the system snapshots the totals, and the difference between the live graph and that snapshot is the day's growth, not a figure to report but a set to render: these nodes, these edges, this region of the map. The figure below traces the path; every view in this note follows from it.
The shape
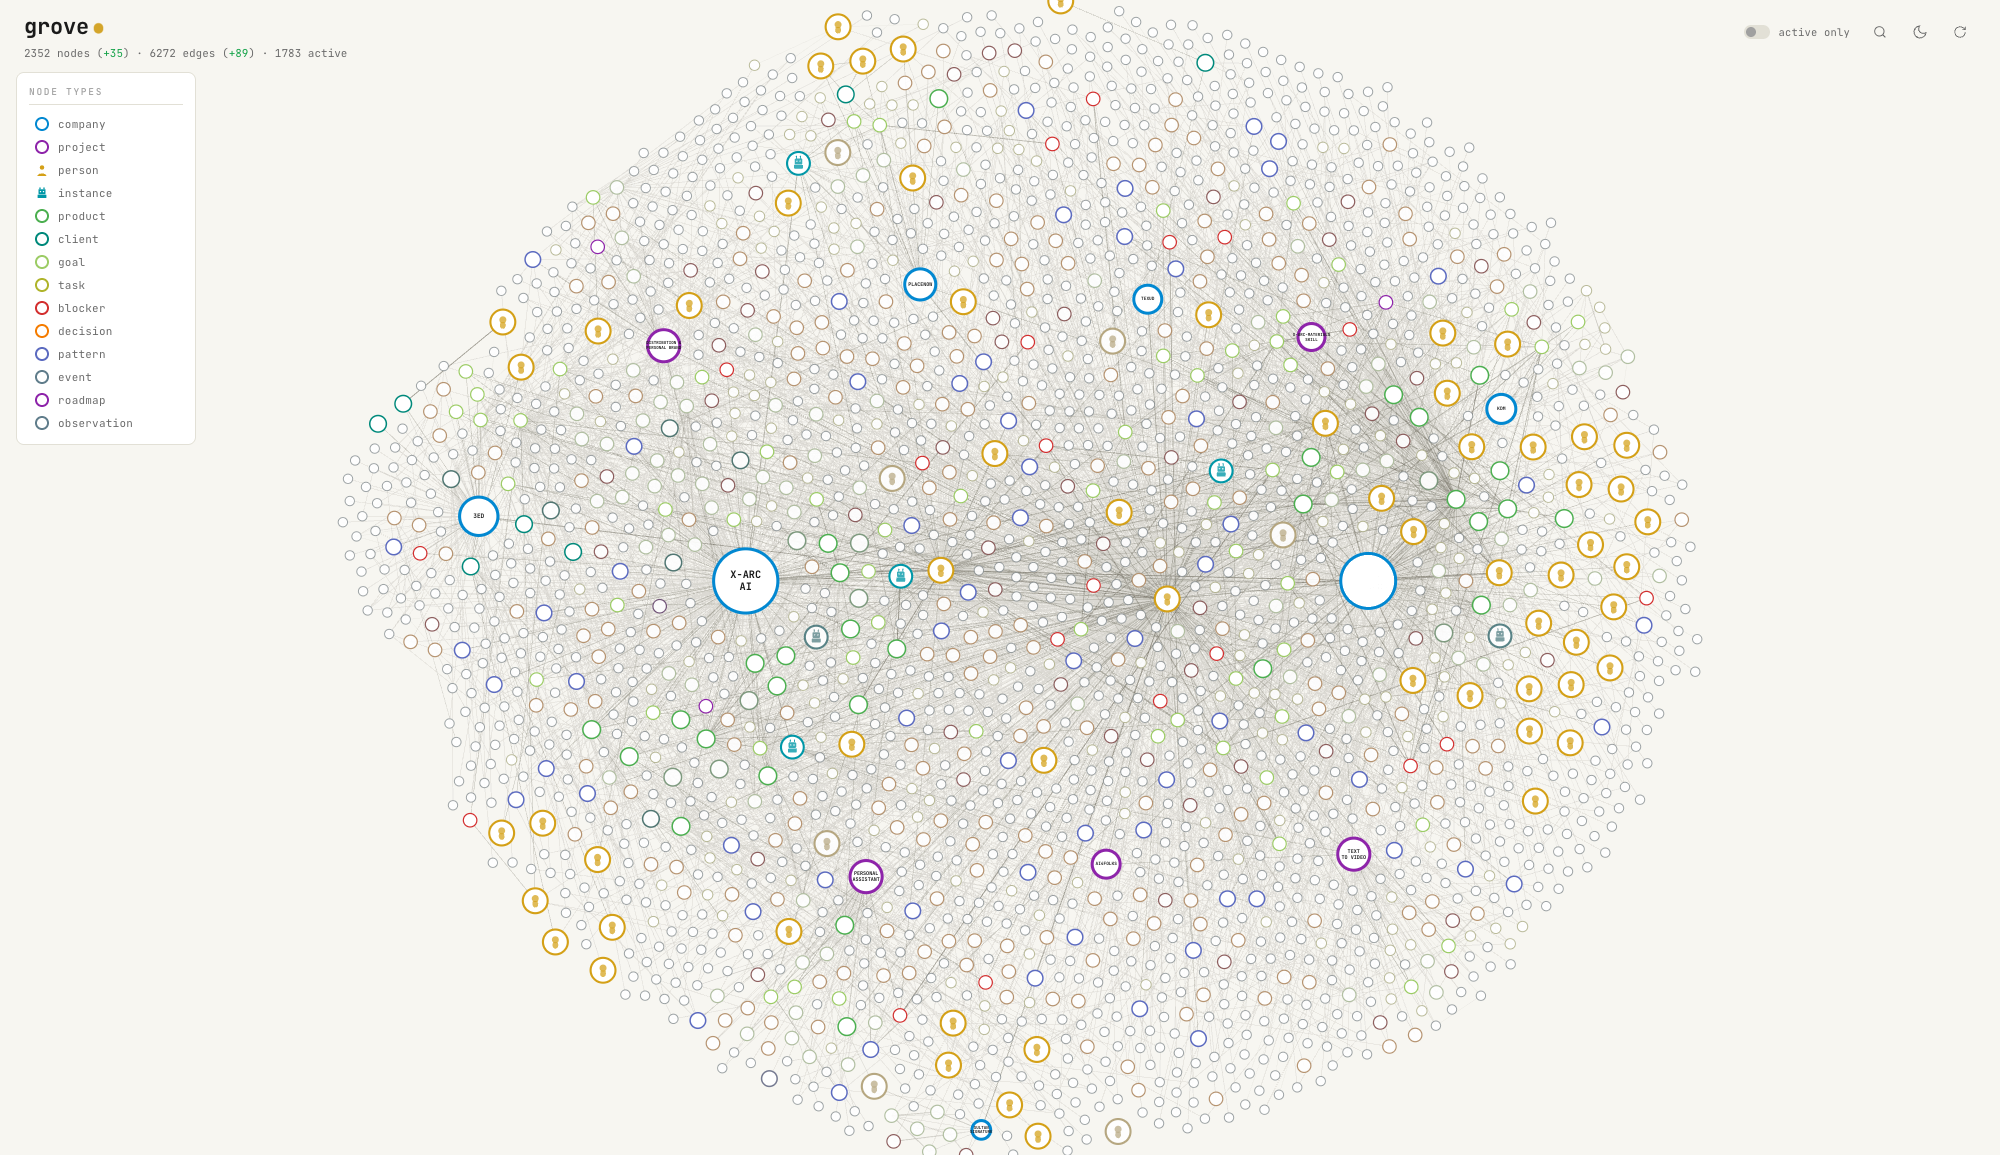
The first fact the viewer establishes is that accumulated memory has a geography. Today the header reads 2352 nodes (+35) · 6272 edges (+89) · 1783 active, and below it those nodes arrange themselves into territory: large anchor disks ringed and threaded by everything that belongs to them. The legend lists fourteen node types, and they are operational words rather than cognitive ones: company, project, person, instance, product, client, goal, task, blocker, decision, pattern, event, roadmap, observation. That is the working vocabulary an earlier note in this series argued an agent actually needs, here printed beside a live canvas.
None of the arrangement is drawn by hand. The viewer designates companies and projects as the only types that may anchor the map; everything else is measured from the live data and recomputed on every load: which anchors dominate, how much area each disk claims, which sit adjacent, and where the other twenty-three hundred nodes settle, pulled among the anchors by the edges they actually hold. We call the result the emergent topology, the shape a graph takes when its layout is derived from its contents rather than composed. The two largest disks on today's map are the owner's two main companies. Nobody configured that; nearly ten months of ingestion measured it.
The schema was designed; the shape was earned.
Grove vs Obsidian
Readers who keep linked notes will recognize the picture: it looks like the graph view Obsidian draws over a vault. The resemblance is visual, and it ends there. In a note graph the nodes are documents and the edges are links a person made by hand, one kind of line that means only that two pages mention each other, so the picture grows denser as the vault grows without growing more legible, a constellation to admire rather than read. Here every node is a typed, dated fact, every edge carries an explicit verb, and the structure is written by the agent and read back by the model as working context. Density under those rules is not noise; it is more to filter by. Two maps can look alike while carrying opposite kinds of information.
 Obsidian
The growth record
The series turns out to have been keeping a longitudinal record without intending one. The note published in April reported 432 nodes and 1,117 edges at the graph's six month mark. The Grove release page, assembled in June, recorded 781 nodes, 2,524 typed edges and 524 active. Today the live header reads 2,352 nodes and 6,272 edges. Edges have outnumbered nodes the whole way, 2.7 to one today, and the most recent day added roughly two and a half edges for every node it added. New facts do not arrive alone; they arrive attached, which is why accumulation compounds into structure instead of piling into a list.
No instrument computed that series. The viewer compares only against yesterday's snapshot; the older figures survive because the lab published them. The record is arithmetic across our own pages, a modest method and an honest one: the same continuously operating graph, counted in public, three times since April.
The delta
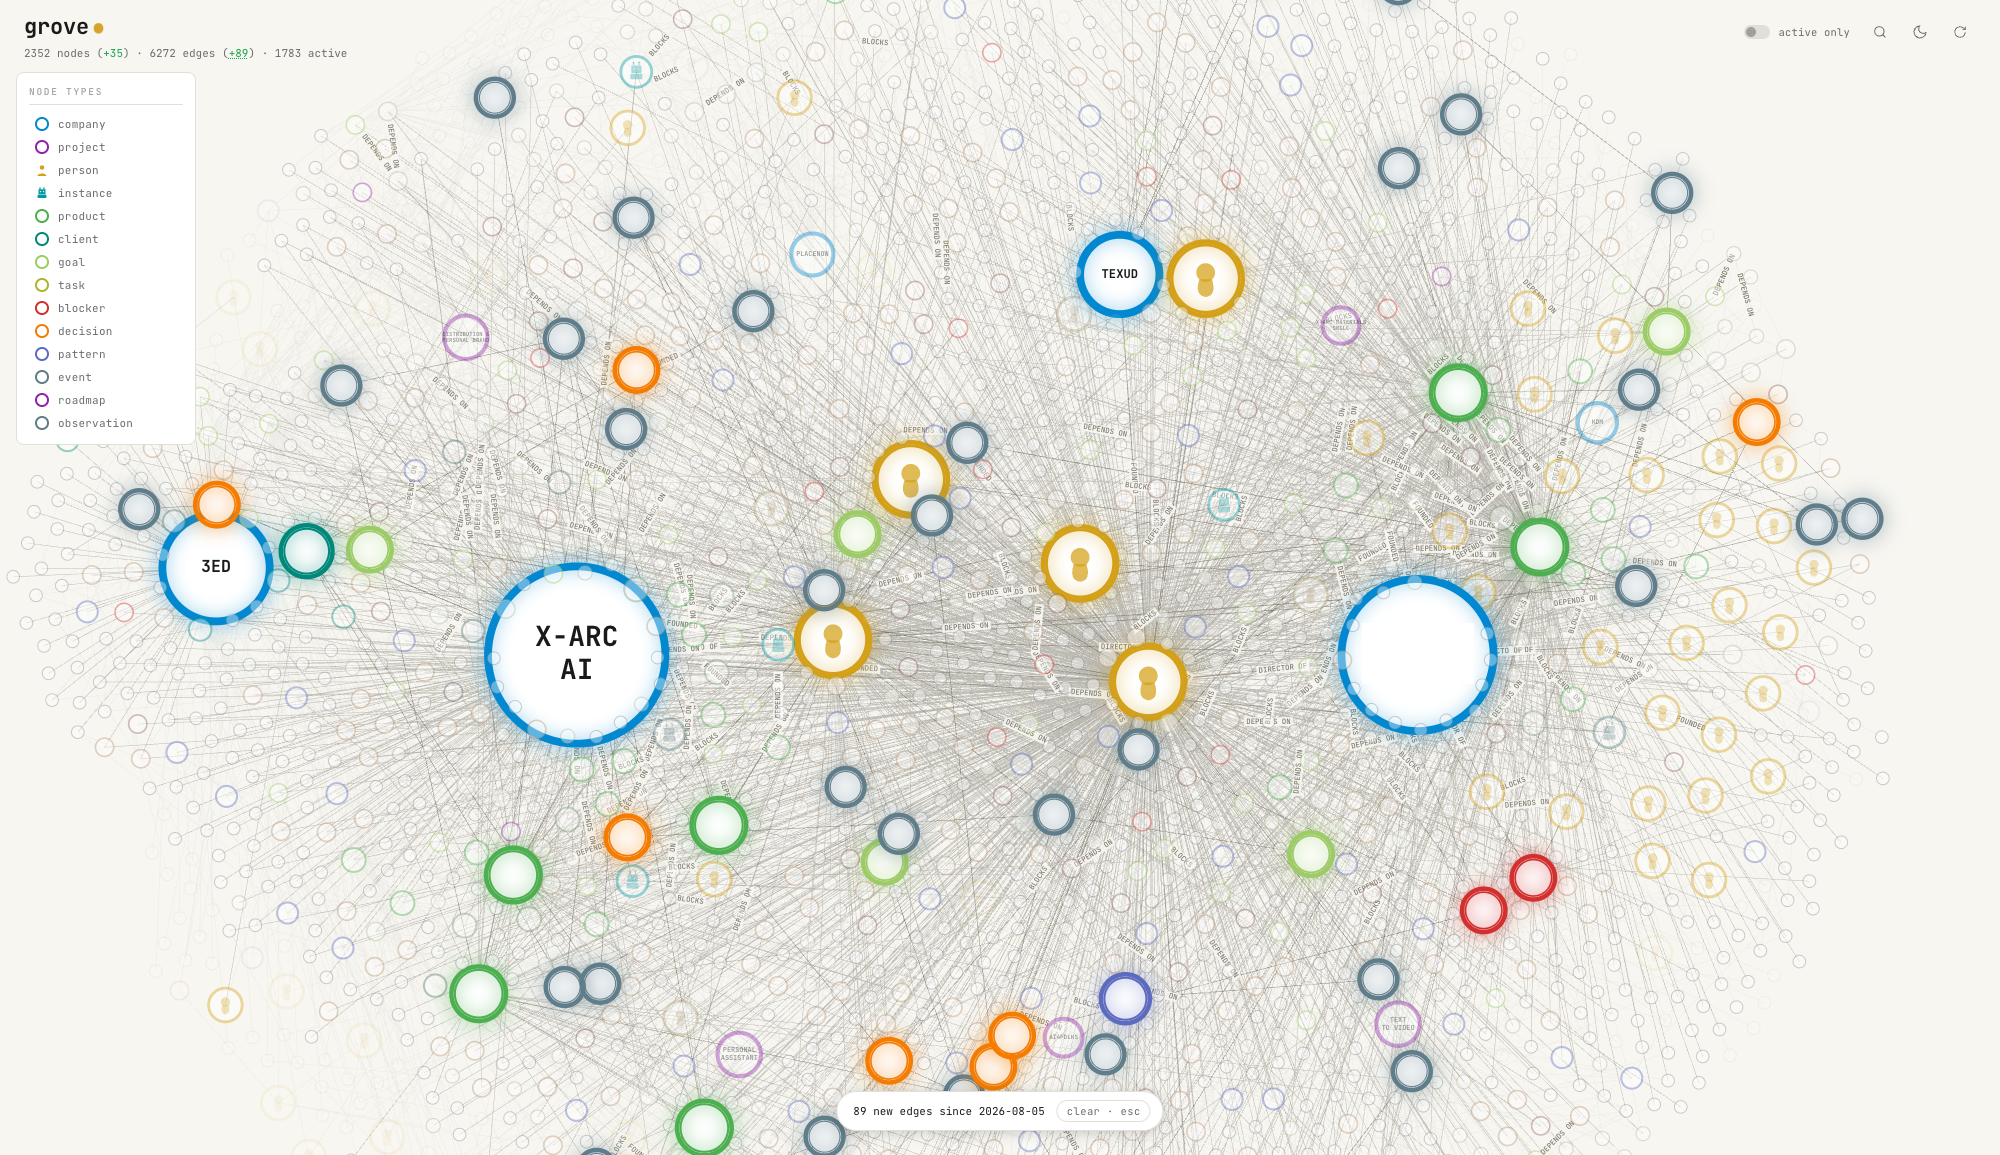
The green figures in the header are the day's growth, 35 nodes and 89 edges, measured against yesterday's snapshot; the tooltip names the baseline, 2,317 nodes and 6,183 edges. Clicking the counter does something no report can. A small badge appears reading "89 new edges since 2026-08-05", the nodes touched by those edges come forward and glow, and the rest of the graph falls back. We call this the visible delta, one day of the agent's learning rendered as a highlighted region of the map. It answers the question an owner rarely gets to ask, not how much was learned yesterday but where: the glow gathers around whichever anchors the day's work touched, so a day spent on one launch lights that neighborhood and leaves the rest dim.
The active count
The header's third figure, 1783 active, carries a definition worth stating. A node counts as active when nothing has closed it and nothing has shelved it: no ending status such as completed, resolved, superseded or archived, no dormant one such as paused, planned or on leave, and no date on which it stopped holding. Active therefore does not mean currently in hand; it means neither ended nor set aside. By that rule roughly three quarters of everything the graph holds is still live, 1,783 of 2,352 nodes, and the rest is retained rather than removed. A related control, the "active only" toggle, clears the map further, hiding the spent classes its tooltip names, "hide completed/archived/sunset/resolved/departed", and with them the graph's running record types (events, observations, tasks, decisions), leaving the durable structure on the canvas. Being finished does not take a fact out of memory; being finished is itself a fact, and the owner chooses whether to look at it.
The relationships view
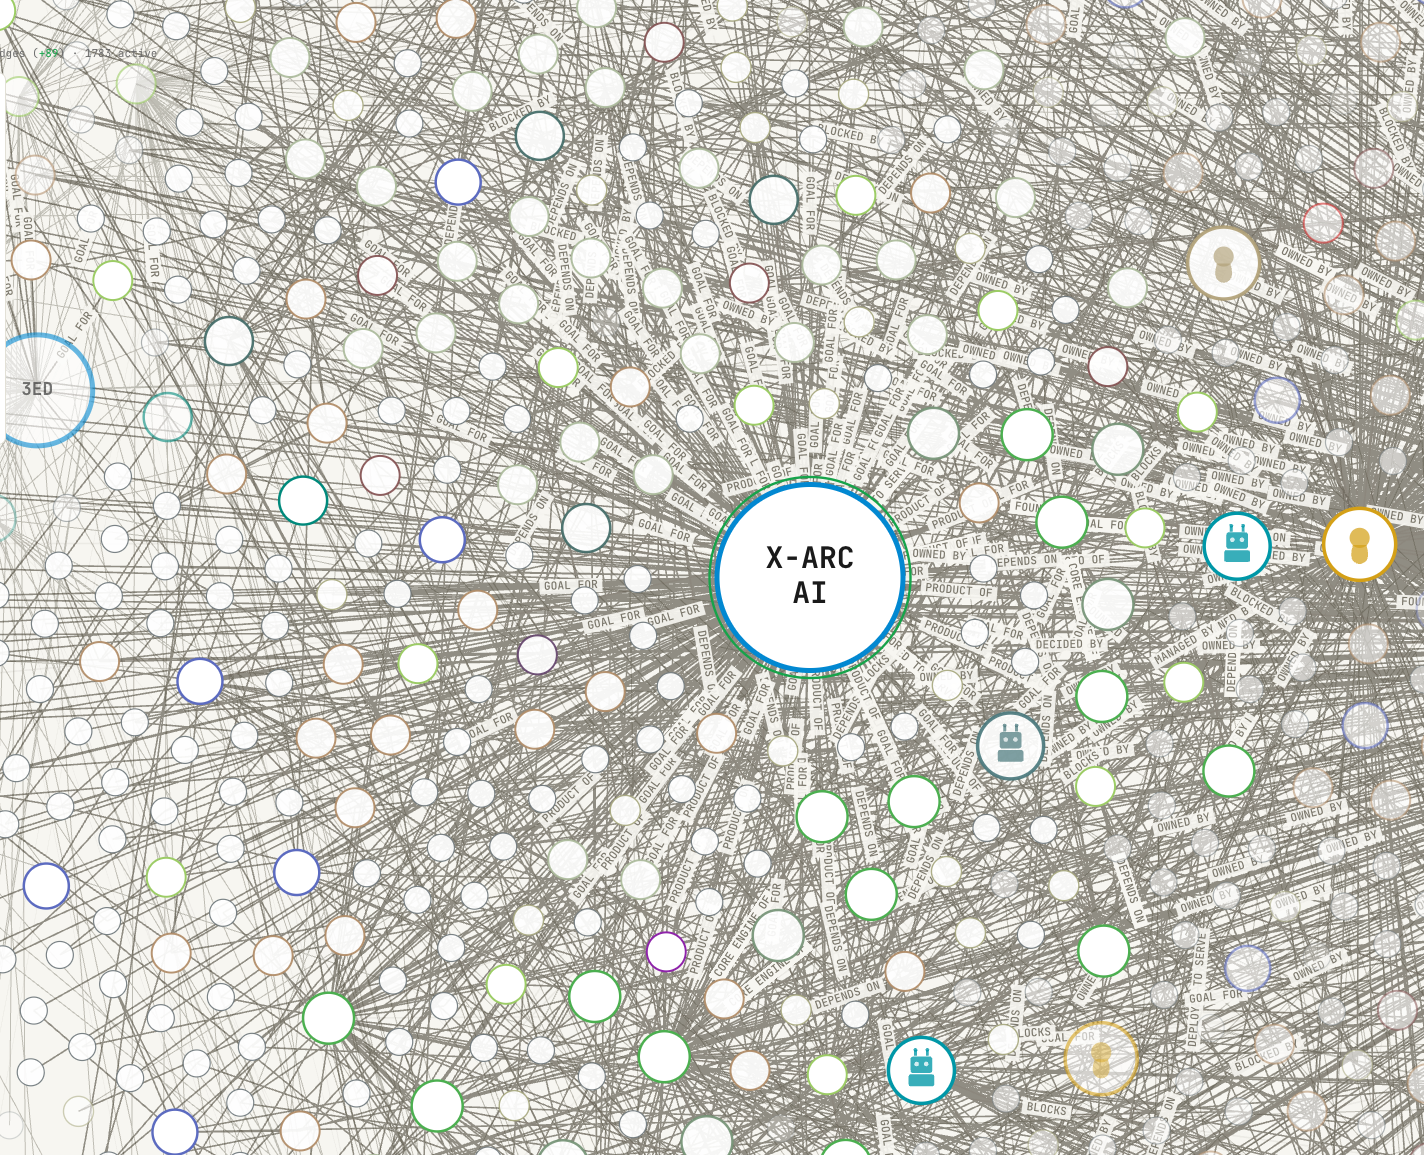
Zoom in and the edges stop being lines and become sentences. Every edge carries a typed meaning and the viewer prints it, DEPENDS ON, BLOCKS, GOAL FOR, OWNED BY, DECIDED BY, FOUNDED, drawn from the 47 distinct verbs on the live graph today. Click a node and the viewer assembles its relationships view, the selected node at center with its labeled edges radiating. A hub's entire situation can then be taken in the way a diagram is taken in rather than the way a query result is: what it owns, what blocks it, what was decided about it, all present at once.
One class of node declines to be read. Person nodes are drawn as anonymous silhouettes, and the default canvas never renders a personal name; identity sits one click deeper, in a detail view the owner can open. This is a rendering rule rather than an access promise, and it is the right default for a personal graph: a glance at the map shows that people exist, where they attach and how much structure they carry, and it surrenders nobody's name.
In most systems relationships are what software walks through; here they are what a person reads.
The inspection
An agent's memory is load-bearing: what it holds shapes every answer the agent gives. Until now the owner's only route to evaluating it ran through the agent, asking and weighing, sampling and hoping. A rendered graph opens a second route. We call what it produces inspectable memory, memory whose state, growth and structure are examined directly rather than inferred from answers. The owner does not take the agent's word that yesterday was productive; the visible delta shows where yesterday landed. The owner does not assume the agent's picture matches the world; the emergent topology shows which parts of that world have earned the most structure, and the active count shows how much of it remains in force.
Three terms from this note join the series vocabulary: the emergent topology, shape derived from contents; the visible delta, a day's learning as a highlighted region; inspectable memory, trust moved from interrogation to sight.
The subject would not sit still for its portrait. When drafting began this morning the header read 2350 nodes and 6265 edges; by early afternoon it read 2352 and 6272. Two nodes and seven edges arrived while this note was being written, and they already sit inside the day's glow. Memory that must be asked about is trusted on faith; memory that can be watched is trusted on sight.
Contact
If something on this page is relevant to work you are running, write to us. The form is on the landing page. We come back within two working days.
Book a discovery call →